
The problem
A leaking water pipeline wastes water, and the water that escapes can damage the soil around the pipe. The repairs that follow are costly. This is why a water pipeline pressure test is carried out and documented before a new distribution pipeline goes into service, with the pipeline required to hold 16 bar for one hour.
Drinking water reaches customers through underground pipes held under pressure, and that pressure sets how fast the water flows. A flow that drops too low harms water quality. During the test, a significant drop in pressure means the pipeline leaks, and the leak can be fixed while the pipeline is still in its production stage. The pressure is followed on site the whole way through, and the end customer can see the result afterwards.
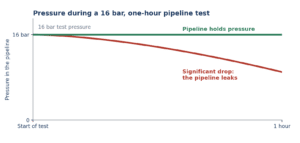
Figure 1. What the test looks for: a pipeline that holds pressure, and one that shows a significant drop. Schematic, not test data.
A construction services company in Switzerland runs this test on new water distribution pipelines. Because pressure is influenced by temperature, the company needs an instrument that shows the pressure on site, compensates for temperature and records what it measures.
The solution
Following the pressure through a one-hour test starts with being able to see it where the test is happening. A digital manometer, which is a pressure gauge with a digital display, does that on site. It runs on its own battery and records pressure and temperature as it goes, so the reading and the record come from the same instrument.
Temperature is the next thing to deal with, because it influences pressure. Each sensor goes through a temperature comparison in special temperature measuring furnaces at the manufacturer, and the results build a mathematical model of that sensor, which is stored inside the manometer. The high-resolution readings are compensated with that model.
The last step is showing the result. The recorded data is held in non-volatile memory, and once the test is finished, a computer reads the recording with the logging software and shows it as a graph. The end customer can then see the result.
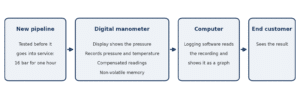
Figure 2. From the pipeline to the end customer: the manometer shows and records the pressure, and a computer turns the recording into a graph.
Products used
The manometer here is the LEO Record, an autonomous, battery-powered digital manometer for recording pressure and temperature over long periods. Its pressure range is −1 to 1000 bar, which places a 16 bar test well inside it, and its accuracy is 0.1% of full scale. It operates from 0 to 50 °C and has IP65 protection. Logger 5 software is included with the unit and is used to configure the manometer and read its data.
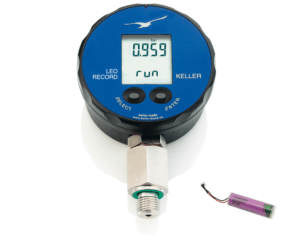
Figure 3. The LEO Record digital manometer with recording function.
Outcomes
- The pressure is on the display for the whole one-hour test at 16 bar.
- A significant drop in pressure points to a leak, and the leak can be fixed while the pipeline is still in its production stage.
- The end customer can look at the recorded pressure as a graph on a computer.
- The company has used the LEO Record for this test for many years.
- Its head of supply system sales says even temporary workers can use it unsupervised after a brief introduction.
To record your own pipeline pressure tests, have a chat with us about your application.
