
The problem
Thousands of people in a large city expect water in their kitchens and bathrooms without delay. Behind that are pumps that can fail or cause pressure surges in the pipes, and industrial facilities that can use large amounts of water very irregularly. Suppliers have to keep enough pressure in the network and prevent damage from defective components. Hydraulic network analysis uses a model of the network to support that work, and water network model calibration keeps the model in step with the real pipes.
The trouble is that a network model is only a snapshot. New housing and new businesses change the network, so the model has to be reviewed each time. The review puts the real network under known operating conditions and compares calculated and measured flow rates and pressures. On a quiet night, demand is low and almost no water flows, so every measured hydraulic grade should read nearly the same. A difference points to an error in the elevation data or a large unknown leak. Under high load, the resistance of the main pipes is checked, and a difference there points to a blockage from a defective fitting or a clog
.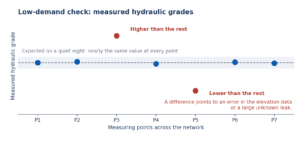
Figure 1. The low-demand check: on a quiet night, measured hydraulic grades should read nearly the same. Schematic, not measured data.
The solution
Water network model calibration begins with what the model is missing: pressure measured on the network itself. Pressure alone does not settle it, though. The pressure drop along a pipe also depends on the pipe-roughness coefficient (the Darcy friction factor, λ), which in turn depends on whether the flow is laminar or turbulent, on the shape of the pipe’s cross-section and on the design of its inner walls.
Other measurements sit around the pressure readings. Flow rates are recorded at key locations for 24 hours, and the storage level and the inflow and outflow of pumps are watched, because all of these influence the measured pressure.
For the pressure itself, digital manometers are spread evenly across the network so that readings come from many points at once. They act as the pressure data loggers and record synchronised pressure values in real time. Those values are used to calculate and fine-tune realistic roughness values and to locate points of resistance in the pipes, which lets the measured and calculated hydraulic grades be lined up.
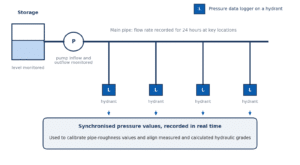
Figure 2. Loggers on hydrants record synchronised pressure values, while storage level, pump flows and main pipe flow rates are measured alongside. Schematic, not to scale.
Products used
The data logger here is a customised LEO Record, a digital manometer that records pressure and temperature over long periods. The customised version comes in a waterproof, stainless steel housing that suits direct installation on above-ground and underground hydrants. The standard LEO Record has a pressure range of −1 to 1000 bar and an accuracy of 0.1% of full scale.
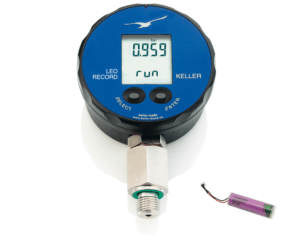
Figure 3. The standard LEO Record. The customised hydrant housing version is not shown.
Outcomes
- Measured and calculated hydraulic grades sit side by side, which shows where the model differs from the network.
- Pipe-roughness values are calibrated from measured pressure, and points of resistance in the pipes are located.
- Differences point to elevation errors, large unknown leaks, and blockages from defective fittings or clogs.
- Problems in the existing network can be corrected, and similar ones avoided when network extensions are designed.
- Energy losses from inefficient feed pumps or inadequate water storage can be found and cut.
